
Introduction
SHRM has called quality of hire the "holy grail" of recruiting — and that label captures exactly how most recruiting teams experience it: deeply important, frustratingly out of reach. LinkedIn research found 75% of talent leaders rank it as the top recruiting metric, yet only 25% of organizations feel confident in how they measure it.
That gap exists for a reason. Quality of hire isn't a single number you pull from your ATS. It's a composite of post-hire outcomes that takes months to develop, spans multiple systems, and requires cross-functional cooperation most teams haven't built.
This guide covers:
- What quality of hire actually is and why it's hard to pin down
- Which metrics compose it and how to weight them
- How to build a measurement scorecard from scratch
- Common mistakes that skew your results
- Practical ways to improve it — before and after the offer is signed
TL;DR
- Quality of hire (QoH) is a combined post-hire score, not a single metric — retention alone doesn't cut it
- Four components drive it: performance, retention, ramp-up time, and manager/cultural fit
- The standard formula: average your indicator percentages; weight performance heaviest (~35%)
- Measure at 90 days for early signals, then again at 12 months for the full picture
- Improvement requires both better candidate sourcing and structured onboarding post-hire
What Is Quality of Hire (and Why Is It So Hard to Measure)?
Quality of hire is a composite, post-hire score that captures the value a new employee delivers to the organization. It typically spans four dimensions: performance, retention, ramp-up time, and engagement or cultural fit. That makes it fundamentally different from process metrics like time-to-fill or cost-per-hire, which measure how efficiently your funnel runs — not what it actually produces.
Why "Quality" Means Something Different for Every Role
There's no universal QoH formula, and that's not a flaw in the concept — it's the nature of the problem. What makes a quality sales hire — fast ramp, consistent quota attainment — looks nothing like what makes a quality engineer, where depth of technical contribution and long tenure on complex projects matter far more. Job family context shapes every input.
This is why SIOP describes QoH as "one of the most frequently discussed yet least standardized metrics in talent management" — organizations agree it matters, but they don't agree on how to define or calculate it.
Two Structural Measurement Challenges
Even once you've defined what quality looks like for a given role, two problems persist:
- The time problem: You can't accurately assess quality until sufficient post-hire time has passed — typically 90 days at minimum, with the most complete picture emerging at 12 months. Full ramp-up can take up to 18 months for complex roles.
- The rater bias problem: Performance reviews and manager surveys are subject to leniency bias, halo effects, and other cognitive distortions. Research from Harvard Business Review found that open-ended review formats invite bias — meaning your QoH data is only as clean as the process that generates it.
Neither challenge disappears entirely. Structured inputs, calibrated review processes, and a consistent scoring cadence are what keep both from distorting your data — which is exactly what the measurement frameworks below are designed to address.
The Key Metrics That Make Up Quality of Hire
QoH is built from two categories: pre-hire metrics that predict quality, and post-hire metrics that measure it. Pre-hire data helps diagnose sourcing and selection problems before they compound; post-hire data validates whether those decisions actually produced results.
Pre-Hire Metrics
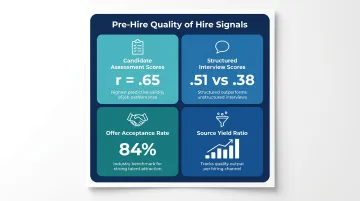
The most actionable pre-hire signals:
- Candidate assessment scores — Schmidt and Hunter's foundational meta-analysis found structured assessments predict job performance with validity coefficients up to .65 when combined with other methods
- Structured interview scores — Structured interviews achieve a validity of .51 vs. .38 for unstructured interviews, a 34% improvement in predictive accuracy
- Offer acceptance rate — The industry benchmark sits at 84% (Gem, 2025, based on 1.3 million hires); significant drops below this can signal compensation misalignment or candidate quality issues
- Source yield ratio — Not all sourcing channels produce equal quality. Tracking which channels generate hires who go on to perform well is foundational to improving QoH over time
One growing threat to pre-hire signal quality: AI-generated applications. Gartner predicts 25% of candidate profiles will be fake by 2028, and 49% of hiring managers already auto-dismiss resumes they suspect are AI-generated. When application volumes are inflated by fake or mass-generated submissions, screening signals degrade before you've interviewed anyone.
Outbound sourcing is one structural fix: going directly to verified candidates rather than waiting for inbound applications sidesteps inflated pipelines entirely. Platforms like Obra Hire address this specifically — their verified profile filtering and competency-based matching evaluate candidates on structured skill data rather than resume text, and recruiters can preview a candidate pool before spending any contact credits.
Post-Hire Metrics
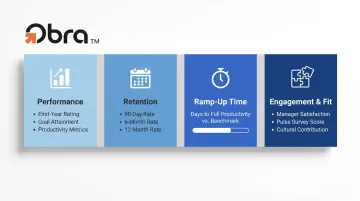
The four core post-hire categories used in strong QoH frameworks:
| Category | What to Measure |
|---|---|
| Performance | First-year performance rating, goal attainment, role-specific productivity metrics |
| Retention | New hire retention at 90 days, 6 months, and 12 months |
| Ramp-Up Time | Days from hire date to full productivity vs. role-specific benchmark |
| Engagement & Fit | Manager satisfaction at 90 days, new-hire pulse vs. team baseline, cultural contribution rating |
A note on retention: it is not a proxy for quality. Someone who reaches day 91 and underperforms is not a quality hire. Someone who leaves at month 10 after delivering strong results shouldn't automatically crater your QoH score without context. Retention is one input, not the whole answer.
As programs mature, teams can add: end-of-probation review scores, onboarding satisfaction surveys, 360-degree feedback, and promotion velocity for roles where upward progression is typical.
How to Build a Quality of Hire Scorecard
The standard QoH formula is straightforward:
QoH = (Metric 1 % + Metric 2 % + Metric 3 % …) ÷ Number of Indicators
The strength of this formula isn't its complexity — it's the team's commitment to consistent inputs. A simple scorecard measured every quarter beats a sophisticated model that never gets off the ground.
A Practical Starting Scorecard
For teams new to QoH measurement, start with three inputs measured at 90 days:
- Ramp-Up Time Score — actual days to productivity ÷ role benchmark, expressed as a percentage
- End-of-Probation Performance Rating — rating vs. satisfactory threshold, scored 0–100
- Job Fit — average of hiring manager score and new-hire self-assessment on a 0–10 scale, converted to a percentage
Average the three percentages. That's your 90-day QoH. Repeat at 12 months with updated performance and retention data.
Weighting Your Inputs
A common starting weighting framework:
| Component | Weight |
|---|---|
| Performance | 35% |
| Retention | 25% |
| Manager Satisfaction | 25% |
| Ramp-Up Time | 15% |
These weights reflect a general priority order, not a universal law. A customer-facing role might weight retention higher; a specialized technical role might weight ramp-up time more heavily. Weights should reflect your business priorities, not just what's easiest to collect.
Cross-Functional Ownership
QoH data is scattered across systems: performance ratings in your HRIS, engagement scores in pulse tools, and manager feedback that requires its own surveys. TA can't build this picture alone.
Form a cross-functional team — Talent Acquisition, HRBPs, hiring managers, and where relevant, Finance — to agree on inputs, weights, and review cadence before launching a formal scorecard. Without shared ownership, data will be incomplete and the scores will reflect gaps in collection, not gaps in hiring quality.
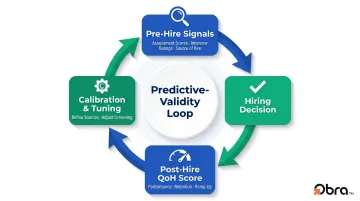
The Predictive-Validity Loop
The scorecard becomes a calibration tool when post-hire QoH scores are regularly compared back to pre-hire signals — assessment scores, interview ratings, source of hire. This comparison lets you tune each new hiring cohort based on what actually predicted success in the last one. Over time, you'll identify which sources, assessors, and screening steps most reliably forecast on-the-job performance — and stop investing in the ones that don't.
Common Quality of Hire Measurement Mistakes
Using a Single-Metric Proxy
The most common mistake: treating 90-day retention as a stand-in for QoH. LinkedIn's talent experts explicitly flag that 90-day turnover has "little causation with actual quality" when used as a standalone metric. QoH requires a composite — full stop.
Over-Engineering Before Measuring Anything
The opposite trap is just as damaging. Teams that spend months designing a 30-input framework with alignment workshops and data audits — but publish zero results — are consistently outperformed by teams that launch a three-metric scorecard, review it quarterly, and iterate. Start simple, publish something, and expand once you have real data to build on.
Keeping QoH Siloed Inside Talent Acquisition
The most meaningful QoH data — performance ratings, engagement scores, manager assessments — lives outside TA's systems. When TA owns the program unilaterally, it creates a predictable measurement bias:
- TA-controlled inputs (time-to-fill, offer acceptance) get tracked rigorously
- Post-hire data that reveals actual hiring quality gets collected inconsistently or not at all
- The result is a scorecard that measures recruiting activity, not hiring outcomes
Build shared accountability into the program from day one. Regular cross-functional reviews — not just internal TA reporting — are what keep QoH scores credible.
How to Improve Quality of Hire
Measuring QoH without acting on it wastes the effort. Improvement levers exist across two stages: what happens before the hire and what happens after. Both matter, and neither compensates fully for failure in the other.
Improve Pre-Hire Quality
The highest-leverage pre-hire improvement is sourcing better-matched candidates from the start. When hiring teams shift from waiting for inbound applications to proactively sourcing against specific competency requirements, the pre-hire signal improves before any screening begins.
Obra Hire's outbound model supports this by letting recruiters search 800M+ profiles using competency-based matching — previewing pool composition and individual profiles before spending any contact credits, so candidate quality is validated upstream rather than discovered during interviews.
The second critical pre-hire lever: structured interviewing. Standardized questions, consistent scoring criteria, and calibrated rubrics reduce rater bias and produce interview scores that actually predict post-hire performance. Companies implementing structured interviews alongside validated pre-hire assessments consistently show the strongest correlation between pre-hire scores and QoH outcomes.
Improve Post-Hire Quality
Even strong pre-hire decisions get undermined by poor onboarding. A high-quality hire can still register as a low-QoH score if the organization fails to ramp them effectively — and the numbers reflect how common that failure is:
- Only 12% of employees strongly agree their organization does a great job onboarding (Gallup)
- 22% of new hires leave within the first 90 days, with 60% of those departures attributed to disorganized training
- Effective structured onboarding programs can increase new hire retention by 82% and improve productivity by more than 70%

Structured 30/60/90-day milestones, role clarity conversations, and manager check-ins address the ramp-up and retention components of QoH directly.
On the manager side, Gallup's research found that managers account for 70% of the variance in employee engagement scores. Employees who receive meaningful weekly feedback are significantly more engaged, making manager behavior one of the most controllable post-hire quality levers available.
Regular 30- and 90-day check-ins serve a dual purpose: they generate the post-hire data you need for your QoH scorecard, and they surface early fit problems while there's still time to intervene through coaching or role adjustment — before losing the hire entirely.
Frequently Asked Questions
How do you measure quality of hire on a scorecard?
A QoH scorecard combines 3–5 weighted indicators — typically ramp-up time, performance rating, manager satisfaction, and retention — into a composite score calculated as the average of the indicator percentages. Review it at 90 days for an early read, then again at 12 months for a complete picture.
What HR metrics should be included in a quality of hire scorecard?
The four core categories are performance, retention (90 days and 12 months), ramp-up time (days to full productivity vs. role standard), and engagement or fit (manager satisfaction plus new-hire self-assessment). Onboarding survey scores and promotion rate can be added as your program matures.
What is a good quality of hire score?
There's no universal benchmark. A "good" QoH score is defined relative to your own historical averages and business targets. The goal is an upward trend across successive hiring cohorts — that trend signals your selection process is improving.
How often should quality of hire be measured?
Calculate QoH at the end of the first 90 days and again at 12 months. Then review aggregate scores quarterly to spot trends across roles, departments, or sourcing channels.
What is the difference between quality of hire and quality of candidate?
Quality of candidate is a pre-hire score based on assessment results and structured interview ratings — it predicts QoH but doesn't measure it. Quality of hire is calculated after the person joins, using actual post-hire outcomes. Tracking both over time turns your QoH dashboard into a calibration system for improving future hiring decisions.