Introduction
Most talent acquisition teams aren't struggling because they lack data. They're struggling because they're tracking 12 metrics, acting on none of them, and still can't explain why time-to-fill keeps creeping up while hire quality stays flat.
The stakes are real. According to the U.S. Department of Labor, a bad hire costs at least 30% of that employee's first-year earnings — and SHRM puts total recruiting and onboarding costs as high as $240,000 per mishire. Meanwhile, 71% of U.S. employers report difficulty finding skilled talent in 2025, up from just 32% a decade ago.
Fewer, better KPIs beat a crowded dashboard every time.
This guide organizes recruitment KPIs into three practical categories — Speed & Efficiency, Cost & Sourcing, and Quality & Candidate Experience — so your team can focus on the metrics that drive real hiring outcomes.
TL;DR
- Recruitment KPIs are goal-tied metrics that measure whether hiring is delivering the right people, at the right speed, at the right cost
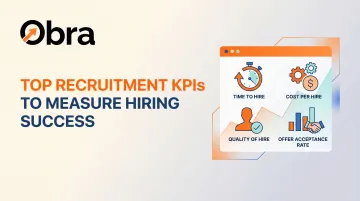
- Speed KPIs (Time to Fill, Time to Hire, Pipeline Velocity) show exactly where candidates stall in your funnel
- Cost & Sourcing KPIs (Cost per Hire, Source of Hire) reveal whether budget is flowing toward channels that actually convert
- Quality & Experience KPIs (Quality of Hire, Offer Acceptance Rate, cNPS) connect recruiting effort to real business outcomes
- Track 4–6 KPIs tied to your current hiring goal — not the entire list at once
What Are Recruitment KPIs?
A KPI is a goal-linked signal that tells you whether your hiring process is working, not just how busy it is. The distinction is practical: "number of applications received" is a metric. "Submit-to-interview ratio" is a KPI, because it tells you whether your screening is converting volume into viable candidates.
Why KPIs Matter Beyond HR
The right KPIs help TA teams translate recruiting activity into business language leadership actually responds to:
- Quantify ROI on recruiting spend across channels and tools
- Hold stakeholders accountable — hiring managers, interviewers, and decision-makers
- Connect hiring efficiency to revenue and growth targets
The Common Pitfall: Too Many Metrics
Most organizations track 10+ metrics but act on none — a crowded dashboard creates noise, not clarity. The right KPI set depends on three factors:
- Company size — a 50-person startup and a 5,000-person enterprise have different bottlenecks
- Growth stage — rapid scaling demands speed KPIs; mature organizations need quality metrics
- Current hiring goal — attrition problems call for different KPIs than pipeline volume problems
Speed and Efficiency KPIs
Time to Fill vs. Time to Hire — Know the Difference
These two metrics are frequently confused, and mixing them up leads to misdiagnosing where your process is actually breaking down.
| Metric | Measures | Who Uses It |
|---|---|---|
| Time to Fill | Job req approval → Offer acceptance | Leadership, workforce planning |
| Time to Hire | Candidate enters pipeline → Offer acceptance | Recruiter performance, process efficiency |
Time to Fill reflects the full organizational cycle, including how long it takes to get a req approved. Time to Hire isolates recruiter and process efficiency. If Time to Fill is high but Time to Hire is low, the bottleneck is upstream — in approval workflows, not recruiting.
Those definitions matter because the benchmarks are unforgiving. SHRM's 2025 Recruiting Benchmarking Report places the U.S. average time to fill at 44 days, up 37% from 2022 according to Greenhouse data.
Meanwhile, the top 10% of candidates are off the market in roughly 10 days — a 4x mismatch between average hiring speed and candidate availability.
Pipeline Velocity and Funnel Conversion Ratios
Pipeline velocity is the diagnostic layer beneath time-based KPIs. Rather than measuring total elapsed time, it identifies which stage is causing delays.
Stage-level data tells you exactly where to intervene:
- Backlog at hiring manager review — usually an alignment problem, not a sourcing problem
- Bottleneck at screening — often points to job description accuracy issues
- Slow offer stage — typically reflects approval workflow delays, not recruiter performance
Two conversion KPIs worth tracking alongside velocity:
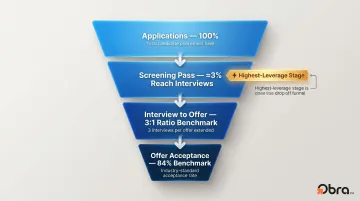
- Submit-to-Interview Ratio — ideally close to 1:1; high ratios indicate over-screening or poor job description clarity
- Interview-to-Offer Ratio — the optimal benchmark is approximately 3:1; ratios above 5:1 inflate cost per hire and signal screening quality issues
For context: CareerPlug's 2025 Recruiting Metrics Report shows only 3% of applicants make it to interviews — meaning 97% are eliminated at screening. That makes screening the single highest-leverage stage in the entire funnel.
Cost and Sourcing KPIs
Cost per Hire
The industry-standard formula, established by SHRM and ANSI:
Cost per Hire = (Internal Recruiting Costs + External Recruiting Costs) ÷ Total Number of Hires
Internal costs include: recruiter salaries, hiring manager time, referral bonuses, ATS/technology fees, signing bonuses
External costs include: agency fees (typically 15–25% of annual salary), job board spend, advertising, background checks, career fair expenses
Current benchmarks:
- Nonexecutive roles: $4,683 average, $1,244 median (SHRM Talent Access Report)
- Nonexecutive roles: $5,475 average (SHRM 2025 Benchmarking Report)
- Executive roles: $28,329 average
The wide variance demands segmented tracking by role type — averaging across all positions obscures where costs are actually accumulating.
A key caveat: a low cost-per-hire that comes from cutting quality is a false economy. The real goal is reducing cost while maintaining hire quality. Teams that rely heavily on agency fees or purely inbound channels often find that switching to outbound sourcing — platforms like Obra Hire give direct access to 800M+ verified candidate profiles — reduces spend without sacrificing candidate pool quality.
Source of Hire and Sourcing Channel Effectiveness
Source of Hire tracks which channels produce actual hires. The more powerful version — Source of Quality — tracks which channels produce hires who stay and perform.
The data here is stark:
| Channel | % of Applicants | % of Hires | 3-Year Retention |
|---|---|---|---|
| Job Boards | 51.2% | 19.75% | ~14% |
| Career Sites | 36.4% | 30.4% | — |
| Employee Referrals | 2.78% | 12.56% | ~47% |
| Internal Hires | 0.53% | 8.47% | Highest |
Employee referrals represent less than 3% of applicants but produce over 12% of hires — and referred employees stay at 3x the rate of job board hires. Internal candidates show the highest individual conversion rate of any channel.
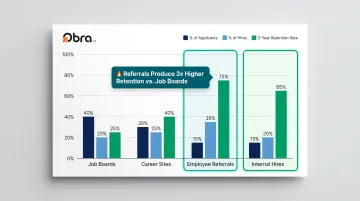
Those retention numbers connect directly to Source of Quality — and to budget allocation. If 51% of your applicants come from job boards but those hires churn within a year, reallocating toward referral programs or outbound sourcing is a financial decision, not just a sourcing preference.
Quality and Candidate Experience KPIs
Quality of Hire — The North Star KPI
Quality of Hire is the KPI that most directly connects recruiting effort to business value. It's also the most underused: only 27% of organizations currently measure it, despite LinkedIn naming it the #1 priority for talent acquisition over the next five years.
The standard formula (LinkedIn Talent Solutions):
Quality of Hire = (Performance Rating + 1-Year Retention + Hiring Manager Satisfaction) ÷ 3
Components should be tailored to role type — some organizations add cultural fit scores or ramp-up time. The specific inputs matter less than consistency: define your components before measuring, then track the trend over time rather than chasing a single score.
Worth noting on timing: it can take up to 18 months for a new hire to fully ramp. Measuring Quality of Hire at 30 days produces misleading data.
Improving this KPI starts at sourcing. Teams that reach pre-vetted, competency-matched passive candidates — rather than waiting for inbound applications — see stronger hire performance because the qualification bar is applied before the funnel begins.
Platforms like Obra Hire use structured skill criteria (not resume keyword matching) to surface candidates whose abilities align with role requirements before they ever enter a screening call.
Candidate Net Promoter Score (cNPS)
cNPS measures how likely candidates are to recommend applying at your company, calculated as:
cNPS = % Promoters − % Detractors (from post-process surveys)
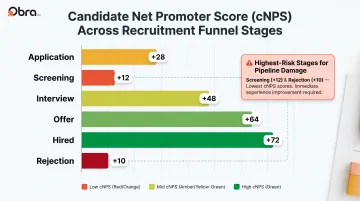
Benchmark cNPS scores vary significantly by funnel stage:
| Stage | Average cNPS |
|---|---|
| Application | +28 |
| Screening | +12 |
| Interview | +48 |
| Offer | +64 |
| Hired | +72 |
| Rejection | +10 |
Screening and rejection have the lowest scores — where candidates most often feel ignored or receive no feedback. A poor cNPS at these stages directly damages future pipeline fill rates, since candidates who feel dismissed don't refer others and don't reapply.
Segment scores by recruiter, stage, department, and role type to identify where the experience breaks down. The most common causes of low scores are:
- Slow or absent feedback after screening
- Communication gaps between stages
- Abrupt rejections with no explanation
Offer Acceptance Rate and Hiring Manager Satisfaction
Offer Acceptance Rate (OAR) = (Accepted Offers ÷ Total Offers Extended) × 100
Current benchmark: 84% per Gem's 2025 data, with a healthy target range of 85–90%. Below 75% signals systemic issues.
A declining OAR is usually an early warning of one of four problems:
- Compensation misalignment with market data
- Gap between what candidates heard in interviews and what was offered
- Weak employer brand perception
- Poor interview experience damaging enthusiasm before the offer stage
Hiring Manager Satisfaction is a qualitative KPI measured through post-hire surveys, with a healthy benchmark around 80%. Low scores typically point to one of three root causes:
- Misalignment on role requirements before the search begins
- Weak candidate quality from the recruiter's pipeline
- Fulfillment timelines that don't meet business needs
Surfacing this data — even when results are uncomfortable — makes the recruiter–hiring manager relationship more productive. It replaces vague frustration with specific, fixable feedback.
How to Build Your Recruitment KPI Framework
Not every KPI matters equally at every stage. Match your KPI set to your most pressing hiring challenge:
| Hiring Objective | Priority KPIs |
|---|---|
| High-growth / rapid scaling | Time to Fill, Hires to Goal, Pipeline Velocity |
| Battling attrition | Quality of Hire, 1-Year Retention Rate |
| Cost reduction | Cost per Hire, Source of Quality |
| Employer brand issues | cNPS, Offer Acceptance Rate |
Review Cadence
Not all KPIs deserve the same attention frequency:
- Weekly review — leading indicators: pipeline velocity, source mix, funnel conversion rates, cNPS by stage. These allow real-time course correction
- Quarterly review — lagging indicators: Quality of Hire, new hire retention, Cost per Hire. These require time to reflect meaningful patterns
Tracking this cadence inside your ATS or HRIS — rather than separate spreadsheets — is what keeps it from collapsing under its own weight. Obra Hire's 85+ integrations with platforms like Workday, Greenhouse, iCIMS, Lever, and SAP SuccessFactors push candidate data into existing systems automatically, so reporting doesn't require manual effort.
Applying SMART Criteria to KPI Targets
Teams that skip target-setting end up with vanity metrics that look fine on a dashboard but don't drive decisions. Every KPI target should be:
- Specific — tied to a defined role, team, or department
- Measurable — tracked via system data, not gut feel
- Achievable — benchmarked against industry peers
- Relevant — connected to a current business priority
- Time-bound — reviewed on a defined cadence
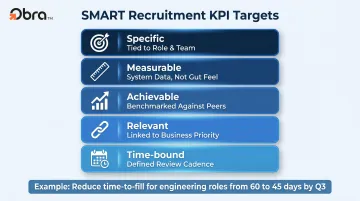
A vague goal like "hire faster" produces nothing. "Reduce time-to-fill for engineering roles from 60 to 45 days by Q3" is actionable.
Conclusion
Mastering recruitment KPIs isn't about collecting more data — it's about choosing the handful of metrics that signal whether your recruiting process is healthy, cost-efficient, and producing people who stay and perform. The three-category framework (Speed, Cost & Source, Quality & Experience) gives any TA team a practical starting point without getting lost in metrics that don't move the needle.
Start with three or four KPIs tied directly to your most pressing hiring challenge. Obra Hire is built to support all three categories — with 85+ ATS/HRIS integrations that feed data directly into existing workflows, a free plan requiring no setup or credit card, and outbound candidate search across 800M+ verified profiles so your sourcing data is accurate from the start.
Frequently Asked Questions
What is a KPI in recruitment?
Recruitment KPIs are the most important, goal-aligned metrics used to evaluate whether a hiring process is attracting, screening, and placing the right talent efficiently. They differ from general metrics because they're tied to specific business outcomes — not just activity counts like applications received or emails sent.
What is the difference between time to fill and time to hire?
Time to Fill measures the full span from job req approval to offer acceptance — the metric leadership uses for workforce planning. Time to Hire measures from when a candidate enters the pipeline to offer acceptance, which evaluates recruiter and process efficiency. Confusing the two makes it harder to pinpoint where slowdowns happen.
How do you calculate cost per hire?
Use the SHRM/ANSI formula: (Internal Recruiting Costs + External Recruiting Costs) ÷ Total Number of Hires, then compare against the SHRM average of $4,683 for nonexecutive roles. Internal costs include recruiter salaries, ATS fees, and referral bonuses; external costs cover agency fees, job board spend, and advertising.
What is a good quality of hire score?
There's no universal benchmark because Quality of Hire is a composite metric whose components vary by organization. Define your inputs first (typically performance rating, 1-year retention, and hiring manager satisfaction), then track the trend over time rather than chasing a single target number.
How many recruitment KPIs should a hiring team track?
Most teams should track 4–6 KPIs at any given time, selected based on the company's most pressing hiring challenge. Tracking more creates noise and dilutes focus, while tracking too few can leave important process failures invisible until they've caused real damage.
How does sourcing strategy affect recruitment KPIs?
Sourcing strategy affects nearly every KPI downstream. Outbound sourcing of pre-vetted candidates tends to improve Time to Hire, Offer Acceptance Rate, and Quality of Hire — while high-volume inbound channels require more screening cycles and produce lower hire-to-application conversion rates.