Introduction
Recruiting teams face a recurring challenge: justify the hiring budget without a consistent way to measure what hiring actually costs. The number most people cite — SHRM's $5,475 average for non-executive roles — captures direct recruiting costs only. Add vacancy losses, bad hire risk, and interviewer time, and the real figure can easily double or triple that.
This guide builds an accurate picture of your cost per hire, covering:
- The SHRM/ANSI formula and how to apply it
- 2026 benchmarks by role seniority, industry, and company size
- Hidden costs most teams miss entirely
- Practical levers that actually move the number down
TLDR
- The SHRM national average CPH for non-executive roles is $5,475; executive hires average $28,329
- CPH = (Total Internal Costs + Total External Costs) / Total Hires — but most teams undercount significantly
- Vacancy costs (~$500/day) and bad hire costs (up to 30% of first-year salary) often exceed the direct CPH figure
- CPH varies sharply by role, industry, and company size — segment before benchmarking, or the national average misleads
- Highest-leverage cost reductions: cut agency dependency, reduce time-to-fill, and shift to outbound sourcing
What Is Cost Per Hire and How Do You Calculate It?
Cost per hire (CPH) is the total spend required to fill one open position — covering all recruiting activity from the moment a role opens to the new hire's start date. It's a core talent acquisition KPI used to measure process efficiency, justify budget requests, and identify where spend is concentrated.
The standard formula comes from the ANSI/SHRM 06001.2012 standard, established in 2012 and still the accepted industry benchmark for cross-organization comparisons:
CPH = (Total Internal Recruiting Costs + Total External Recruiting Costs) / Total Number of Hires
Internal Recruiting Costs
Internal costs originate within your organization and are often harder to quantify:
- Recruiter and HR staff salaries — prorated to hiring activity during the measurement period
- Hiring manager and interviewer time — calculated as hourly rate × hours spent per hire (the most commonly omitted cost)
- Employee referral bonuses paid out during the period
- ATS and sourcing tool subscriptions — divided across total hires for the period, not billed per role
- Administrative and compliance effort — background check coordination, offer letter prep, onboarding paperwork
External Recruiting Costs
These are easier to track because they appear as direct vendor invoices:
- Job board posting fees
- Recruitment agency and search firm fees (contingency: 15–25% of first-year salary; retained search: 25–40%)
- Background checks and pre-employment assessments
- Candidate travel and relocation
- Career fair and event costs
Why CPH Is Routinely Undercounted
Most organizations undercount CPH because they only capture obvious line items like job board fees. The harder-to-track categories — interviewer time, screening costs for rejected candidates, ATS subscriptions spread across fewer hires than expected — are frequently excluded.
Measuring quarterly helps, but consistency matters more than cadence. Agree on exactly which cost categories to include before your first measurement cycle; changing definitions mid-year makes trend comparisons unreliable.
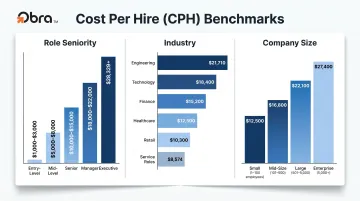
Cost Per Hire Benchmarks 2026: By Role, Industry, and Company Size
SHRM's 2025 benchmarking data sets the national average at $5,475 for non-executive roles and $28,329 for executive hires — a figure that's up 113% from 2017 and 21% from 2022. These are direct recruiting costs only. Loaded CPH — including vacancy costs and bad-hire risk — often runs 3–5x higher once those factors are included.
One additional pressure point: despite a softer labor market, Appcast's 2025 Recruitment Marketing Benchmark Report found that cost-per-application rose to $33.39 and cost-per-hire for marketing-driven applications climbed to $111.11 — driven by job board pricing shifts, not hiring volume.
By Role Seniority
| Seniority Level | CPH Range | Primary Cost Driver |
|---|---|---|
| Entry-level | $1,000–$3,000 | High volume, job board spend |
| Mid-level professional | $3,000–$7,000 | Skills assessment, competitive sourcing |
| Technical/Engineering | $6,000–$10,000 | Talent scarcity, specialized screening |
| Senior/Director | $15,000–$30,000+ | Executive search, longer cycles |
| Executive/C-suite | $28,329+ | Retained search fees, board involvement |
The gap between entry-level and executive is stark — and widens further when you factor in longer time-to-fill and the higher cost of a mis-hire at senior levels.
By Industry
| Industry | Average CPH | Key Cost Driver |
|---|---|---|
| Engineering | $21,710 | Talent scarcity, relocation, technical assessment |
| Professional Services | $20,707 | Specialized knowledge requirements |
| Legal | $16,789 | Credential verification, bar admission |
| Healthcare | $14,167 | Licensing, regulatory background checks |
| Manufacturing | $10,378 | Safety certifications, shift scheduling |
| Service roles | $8,574 | High turnover, frequent rehiring |
Healthcare and legal consistently exceed the national average because mandatory credential verification, licensing checks, and bar admissions add real time and cost to every hire — there's no compliant way to compress that process.
By Company Size
| Company Size | Average CPH |
|---|---|
| Small (1–250 employees) | $4,392 |
| Medium (251–1,000 employees) | $4,325 |
| Large (1,001–5,000 employees) | $4,515 |
| Very Large (5,000+ employees) | $5,487 |
Company size shapes CPH in non-obvious ways. Smaller organizations spread fixed recruiting costs — ATS licenses, recruiter salaries, employer branding — across fewer hires, keeping per-hire costs elevated despite lower absolute spend. Very large enterprises face the opposite pressure: role complexity and compliance overhead (not volume inefficiency) push costs back up at the top end.
Knowing where your organization falls across these three dimensions — role seniority, industry, and company size — gives you a defensible baseline for benchmarking your own program.
The Hidden Costs That Inflate Your True Cost Per Hire
The SHRM formula captures direct recruiting costs. What it omits — vacancy costs, bad hire costs, and the fully loaded time of recruiters and interviewers — typically pushes the real figure several times higher.
Vacancy Costs
Every day a role sits open, the company absorbs a productivity loss. For standard roles, the industry estimate is approximately $500 per day. For specialized or revenue-generating roles, that figure can reach $1,292 per day.
With SHRM's 2025 median time-to-fill at 44 days, the implied vacancy cost per hire is roughly $22,000 — nearly four times the direct CPH figure. That single number explains why reducing time-to-fill often delivers higher ROI than optimizing any other cost category.
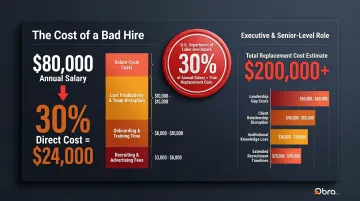
Bad Hire Costs
A bad hire costs up to 30% of the employee's first-year salary in direct costs alone, according to widely cited U.S. Department of Labor estimates referenced by SHRM. Indirect costs (team disruption, lost productivity, a full rehire cycle) push the real figure even further.
For a role with an $80,000 salary, that's a minimum of $24,000 in direct bad hire costs. For senior hires, the figure easily clears $200,000 when the full replacement cycle is included.
This risk is growing. Research from Raconteur documents a sharp rise in AI-generated fake applications — and when teams lack a way to verify candidate authenticity, inbound funnel quality degrades, increasing mis-hire probability. Sourcing verified passive candidates directly — rather than relying on inbound volume — is one practical way to reduce that risk. Obra Hire's database of 800M+ verified profiles, for instance, filters out AI-generated and fake profiles before they enter your pipeline.
Interviewer and Recruiter Time Costs
This is the cost category that almost never appears in CPH calculations, despite being significant.
According to Gem's 2026 Recruiting Benchmarks Report, only 0.5% of applicants receive offers — roughly one hire per 200 applications. Applications surged 93% while TA teams shrank 14%, meaning recruiters now process far more candidates per hire than in previous years.
A concrete example:
- Recruiter spends ~23 hours on screening per hire (resume review + phone screens)
- A four-person interview loop at ~$75/hour costs approximately $300 per candidate per round
- Multiply that across all screened candidates — not just the one hired — and interviewer costs alone can represent 10–15% of total CPH
Most CPH dashboards never capture these hours — which means organizations are consistently underestimating their true hiring spend and making optimization decisions on incomplete data.
How to Reduce Your Cost Per Hire: Proven Strategies
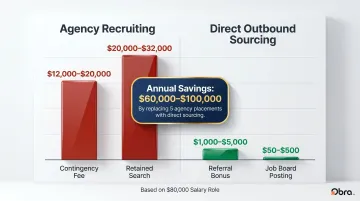
Strategy 1 — Replace Agency Dependency with Direct Outbound Sourcing
Agency fees are the single largest controllable external cost for most organizations. Run the math on an $80,000 role:
- Contingency agency: $12,000–$20,000 per placement (15–25% of salary)
- Retained search: $20,000–$32,000 per placement (25–40%)
- Employee referral bonus: $1,000–$5,000
- Job board posting: $50–$500
Replacing even five agency placements per year with direct sourcing saves $60,000–$100,000 — before accounting for any subscription costs.
Platforms like Obra Hire make this shift practical. At $109–$169/month, teams can search 800M+ verified candidate profiles and contact passive candidates directly — replacing per-placement agency fees with a flat subscription. The verified profile filtering also cuts time wasted screening AI-generated or fake applicants that flood inbound pipelines.
Strategy 2 — Cut Time-to-Fill Through Smarter Sourcing and Automation
At $500/day in vacancy costs, shaving 30 days off time-to-fill saves $15,000 per hire — before touching any direct recruiting expense. The levers that deliver the fastest results:
- AI-powered candidate matching to surface qualified profiles without manual resume screening
- Automated outreach sequences to engage passive candidates at scale
- Interview scheduling automation to eliminate the email-tag that adds 3–5 days to every round
The compounding effect is real: faster sourcing, fewer manual steps, and shorter scheduling cycles each trim days off the calendar — and dollars off every hire.
Strategy 3 — Build Referral Programs and Audit Low-ROI Sourcing Channels
Referral hires consistently outperform every other channel across cost, speed, and retention:
- Save $3,000–$7,500 per hire vs. traditional channels
- Hired 55% faster (29 days vs. 39–55 days for other channels)
- 46% long-term retention vs. 33% for traditional hires
To get more from referrals: make submissions easy, track bonus status transparently, and send automated updates so employees know their referrals aren't disappearing into a black hole.
Referrals work best as part of a broader channel strategy. Audit your source-of-hire data quarterly — job boards that generate applications but not hires drain CPH without return. Cut underperformers and shift that budget toward channels with proven conversion rates.
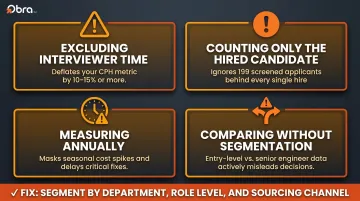
Common Cost Per Hire Tracking Mistakes to Avoid
Four errors account for most CPH miscalculations:
- Excluding hiring manager and interviewer time — artificially deflates the metric by 10–15% or more
- Counting only the hired candidate — ignores the cost of screening, interviewing, and rejecting the other 199 applicants per hire (Gem 2026 data)
- Measuring annually — masks seasonal cost spikes and delays corrective action by months; quarterly is the minimum
- Comparing against the national average without segmentation — a company filling mostly entry-level roles will always show lower CPH than one hiring senior engineers; like-for-like comparisons are the only ones that drive useful decisions
Fixing these mistakes requires more than better math — it requires a structured reporting cadence tied to outcomes:
- Report CPH by department, role level, and sourcing channel each quarter
- Connect CPH trends to specific process changes (new sourcing channel, added interview round, new ATS workflow)
- Pair CPH with quality-of-hire and first-year retention data — a lower cost per hire means nothing if those hires leave within six months
Frequently Asked Questions
What is a good cost per hire?
There's no universal answer — it depends on industry, role seniority, and company size. Use the SHRM average of $5,475 as a starting reference, but benchmark against your own segment and hiring volume. A good CPH reflects process efficiency and produces long-tenure hires, not just the lowest spend.
What is the KPI cost per hire?
Cost per hire measures the total cost to fill one position using the SHRM/ANSI formula: (Internal Costs + External Costs) / Total Hires. Teams track it alongside time-to-fill, quality of hire, and first-year retention to evaluate recruiting efficiency and guide budget decisions.
What is the SHRM formula for cost per hire?
CPH = (Total Internal Recruiting Costs + Total External Recruiting Costs) / Total Number of Hires. Established by SHRM and ANSI in 2012, internal costs include recruiter salaries, ATS subscriptions, and interviewer time; external costs cover agencies, job boards, background checks, and assessments.
What hidden costs are most commonly missed in cost per hire calculations?
The most overlooked costs are daily vacancy losses (~$500/day while a role sits open), bad hire costs (up to 30% of first-year salary per the U.S. Department of Labor), and recruiter/interviewer time spent on candidates who don't make it to offer.
How does company size affect cost per hire benchmarks?
Smaller organizations typically show higher per-hire costs because fixed recruiting infrastructure (ATS, recruiter salaries, employer branding) is spread across fewer hires. Enterprise organizations benefit from scale. Benchmark against companies of similar size and hiring volume for meaningful comparisons.
How does outbound sourcing reduce cost per hire?
Outbound sourcing — proactively contacting verified passive candidates — reduces reliance on job boards and agency fees, which are the largest controllable external cost categories. It also shortens time-to-fill by engaging candidates before they're actively searching, cutting daily vacancy costs alongside direct external spend.