Cost per hire is the average total investment an organization makes to fill a single open position, covering all recruiting activities from sourcing through accepted offer. It's one of the few recruiting metrics that connects directly to financial planning — and according to SHRM's benchmarking data, the average CPH across all roles runs approximately $4,700, with wide variation by role level and industry.
This article covers the standard formula, what to include (and exclude), current benchmarks, and the highest-impact ways to bring costs down without degrading hire quality.
TL;DR
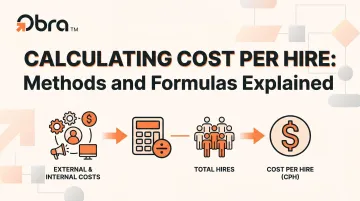
- CPH formula: (Total Internal Recruiting Costs + Total External Recruiting Costs) ÷ Number of Hires in the period
- Internal costs include recruiter salaries, hiring manager time, and ATS fees; external costs cover job boards, agency commissions, and assessments
- SHRM's all-roles average is ~$4,700; the 2025 median is $1,200 for nonexecutive roles and $10,625 for executive roles
- Track CPH quarterly, segmented by role level and department — blended averages hide the data you actually need
- Reducing CPH requires building proactive sourcing pipelines, not simply cutting vendor spend
What Is Cost Per Hire?
CPH measures the average total investment required to bring one new employee from open requisition to accepted offer, combining both in-house and third-party recruiting spend across a defined time period.
What CPH does not include: Post-hire costs — onboarding programs, equipment provisioning, new hire orientation, or role-specific training — are workforce and L&D expenses, not recruiting costs. Including them overstates CPH and makes cross-organization comparisons meaningless.
CPH also works alongside two related metrics, not in place of them:
| Metric | What It Measures |
|---|---|
| Cost per hire | How much it costs to fill a role |
| Time to fill | How long the process takes |
| Quality of hire | How well the new hire performs |
Tracked together, these three metrics tell a more honest story than any one number alone. A low CPH that comes from cutting corners on sourcing or screening often surfaces as a quality problem within the first 90 days — and replacing a mis-hire typically costs 50–200% of that role's annual salary.
The Cost Per Hire Formula: Step-by-Step Calculation
The standard formula, codified in the ANSI/SHRM 06001.2012 standard, is:
CPH = (Internal Recruiting Costs + External Recruiting Costs) ÷ Total Number of Hires
SHRM and ANSI jointly established this formula to give organizations a consistent, comparable methodology. Before calculating, define your time period. Quarterly is the most practical cadence — frequent enough to catch cost trends early without the noise of monthly swings, and aligned with standard budget review cycles.
Defining "a Hire" in the Denominator
The ANSI/SHRM standard defines a hire as a person who has accepted an employment offer and has actually started work. Your definition should also address:
- Full-time and part-time employees: include
- Fixed-term contract workers who went through a formal recruiting process: include
- Internal transfers with a formal requisition process: include if recruiting resources were used
- Temp-to-perm conversions and contractors: organizational discretion — define clearly and apply consistently
Step 1: Sum Total Internal Costs
Convert time into dollars. Multiply hours spent by each participant (sourcing, screening, interviewing, debriefs) by their hourly compensation rate. Then add:
- Recruiter and TA team salaries and benefits, prorated to the period
- Hiring manager and interviewer time (this alone often represents the majority of internal cost)
- ATS, scheduling, and sourcing tool subscriptions, prorated to the period
- Employee referral program payouts
- Administrative overhead: offer drafting, compliance tasks, background check coordination
Step 2: Sum Total External Costs
Pull invoices and receipts for all third-party spend:
- Job board posting and sponsored listing fees
- Staffing agency or search firm commissions
- Background check and pre-employment assessment vendors
- Candidate travel and relocation expenses
- Career fair or recruiting event fees
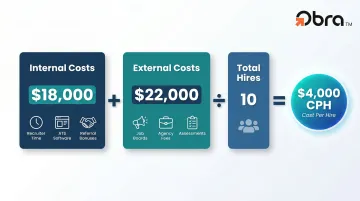
Step 3: Apply the Formula
For a team that closed 10 hires in a quarter:
- Internal costs: $18,000 (recruiter time, ATS, referral bonuses)
- External costs: $22,000 (job board fees, one agency placement, assessments)
- Total hires: 10
CPH = ($18,000 + $22,000) ÷ 10 = $4,000
Step 4: Segment the Result
A single blended CPH number is rarely the most useful output. Break it down by:
- Department: engineering vs. operations frequently carry very different cost structures
- Role level: entry-level, mid-level, senior, and executive hires each benchmark differently
- Sourcing channel: isolate what each channel actually cost per successful hire
With that breakdown in hand, you can cut spend on underperforming channels and redirect budget toward what's working.
What to Include as Hiring Costs: Internal vs. External
The most common CPH errors are categorization errors, not math errors. Teams either undercount by missing hidden internal costs (especially interviewer time) or overcount by pulling in post-hire expenses that belong elsewhere.
According to SHRM's research, soft costs — hiring manager time, screening, and interviews — make up approximately 60% of total CPH, while hard costs like advertising and agency fees account for only 30–40%. Yet most cost-reduction efforts target that smaller pool of hard costs.
Internal Hiring Costs
| Cost Component | Notes |
|---|---|
| TA team salaries and benefits | Prorated to the measurement period |
| Hiring manager and interviewer time | Convert hours × hourly compensation rate |
| Employee referral bonuses | Paid upon hire; counts as a direct recruiting cost |
| ATS and sourcing tool subscriptions | Prorate to the period; platforms like Obra Hire fall here |
| Administrative overhead | Offer drafting, compliance tasks, coordination |
External Hiring Costs
| Cost Component | Notes |
|---|---|
| Job board and sponsored listing fees | Include all platforms used in the period |
| Agency, search firm, or RPO commissions | Typically 15–25% of first-year salary for standard roles |
| Background check and assessment vendors | Per-hire variable costs |
| Candidate travel and relocation | Any expenses the organization covers |
| Career fairs and recruiting events | Full event cost prorated if multiple roles recruited |
| Signing bonuses | Include only when treated as a recruiting incentive |
Cost Per Hire Benchmarks: What's Typical?
SHRM's benchmarking data gives a useful reference frame, but the numbers require context.
Current SHRM figures:
- All-roles average: ~$4,700
- 2025 nonexecutive median: $1,200
- 2025 executive median: $10,625 (up from $5,000 in 2017 — a 113% increase)
The gap between the $4,700 average and $1,200 median reflects a statistical reality: a small volume of expensive executive hires pulls the mean far above what most individual hires actually cost.
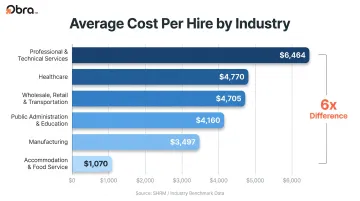
CPH by Industry (Nonexecutive Roles)
Industry benchmarks show how wide the range actually is:
| Industry | Average CPH |
|---|---|
| Accommodation/food service, arts, entertainment | $1,070 |
| Manufacturing | $3,497 |
| Public administration and education | $4,160 |
| Wholesale/retail, transportation, warehousing | $4,705 |
| Healthcare and social services | $4,770 |
| Professional, scientific, technical services | $6,464 |
Source: iCIMS citing SHRM benchmarking data.
The 6x spread between lowest and highest reflects real differences in role complexity, talent scarcity, and sourcing methods — not just hiring efficiency.
Setting Your Own Baseline
Don't chase industry averages. They're useful context, not targets. Instead:
- Track CPH consistently for at least three quarters
- Segment by role level from day one
- Treat your own historical data as the primary benchmark
- Use external figures to spot outliers, not to set goals
A high CPH for an executive or highly specialized role may reflect appropriate investment. An unusually low CPH can signal underinvestment — one that surfaces as a thin pipeline or a mis-hire down the line.
Key Factors That Influence Cost Per Hire
Four structural factors drive most CPH variation:
Role Seniority and Specialization
Senior and niche roles require longer sourcing cycles, more interview rounds, and often agency involvement. Executive search commissions run 25–35% of first-year salary — for a $120,000 role, that's $30,000–$42,000 from one placement alone, often exceeding the entire annual CPH budget for a team of non-executive hires.
Hiring Volume and Company Size
Fixed costs — ATS subscriptions, recruiter salaries — spread across more hires at higher volume, lowering per-hire cost. A small team absorbing those same costs across five annual hires pays far more per hire than a 200-hires-per-year operation spending the same dollar amount on infrastructure.
Sourcing Model
Agency-reliant hiring is the single largest external cost driver for most organizations. Direct sourcing through outbound tools, employee referrals, and talent pipelines substantially reduces that spend over time. LinkedIn's referral program research found referrals are typically the cheapest and fastest hiring channel — with stronger retention outcomes than other sources.
Urgency and Time-to-Fill Pressure
Roles that need to be filled fast activate expensive reactive channels — premium job boards, agencies — even when a slower process would cost less. SHRM has reported that 43% of companies made a bad hire because they felt pressure to fill a role quickly, compounding both the CPH and the downstream replacement cost.
How to Reduce Cost Per Hire Without Compromising Quality
Cost reduction only creates value when hire quality holds. A mis-hire can cost more than $250,000 when you factor in recruitment, lost productivity, and disruption, according to SHRM estimates — which means tactics that lower upfront spend while increasing bad-hire risk are counterproductive.
The Highest-Impact Lever: Proactive Outbound Sourcing
The largest structural shift teams can make is moving from reactive, inbound-only hiring toward proactive outbound sourcing that builds pre-qualified pipelines before roles open. When you're not scrambling to fill an urgent vacancy, you don't pay agency premiums or sponsored listing markups.
Platforms like Obra Hire give hiring teams direct access to 800M+ verified candidate profiles for outbound outreach. At $109/month for the Explore plan (500 contact credits) or $169/month for Scale (1,200 shared credits across the team), the cost per contact is a fraction of what agency commissions add to a single placement.
Credits are only spent when contact information is revealed — so teams can preview candidate pools and validate search criteria before committing any spend.
Obra Hire's Scale plan also pools credits across team members, meaning a candidate's contact details revealed by one recruiter are visible to the whole team — eliminating the duplicate purchasing problem common with per-seat tools.
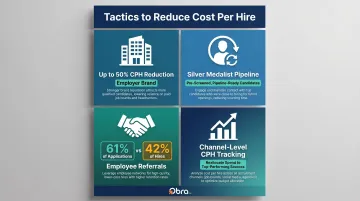
Supporting Tactics That Compound Over Time
These won't generate immediate results, but they build the infrastructure that makes sustainable CPH reduction possible:
- Invest in employer brand — LinkedIn research found strong employer brands deliver up to a 50% reduction in CPH and 28% lower turnover, while weak brands cost at least 10% more per hire.
- Re-engage silver medalist pipelines — past finalists are already pre-screened, familiar with your company, and often open to the right opportunity.
- Build employee referral programs — referrals convert at higher rates than job boards and produce longer-tenured hires. CareerPlug data shows job boards generate 61% of applications but only 42% of hires, a poor return relative to their cost.
- Track channel-level CPH — identify which sources deliver the best cost-to-quality ratio and reallocate spend accordingly. Data almost always contradicts gut instinct about which channels "work."
One prerequisite: None of these tactics are measurable without a stable CPH baseline. Teams that can't track whether process changes are actually reducing costs — or just shifting them elsewhere — are optimizing blind.
Frequently Asked Questions
What is the formula for cost per hire?
The ANSI/SHRM 06001.2012 standard formula is: (Internal Recruiting Costs + External Recruiting Costs) ÷ Total Number of Hires. Both cost categories must be totaled for a defined time period before dividing by the number of hires made in that same window.
What is a good cost per hire benchmark?
SHRM's all-roles average is approximately $4,700, with 2025 medians at $1,200 for nonexecutive roles and $10,625 for executive hires. Professional/technical services CPH runs as high as $6,464 for nonexecutive roles. Your own historical data, segmented by role type, is more actionable than any cross-industry figure.
Should onboarding costs be included in cost per hire?
No. Onboarding, training, equipment provisioning, and new hire orientation are post-hire expenses and excluded from CPH under standard SHRM/ANSI methodology. CPH captures only costs incurred from open requisition through accepted offer.
How often should cost per hire be calculated?
Quarterly is the most practical cadence for most organizations. It provides enough data to surface meaningful trends without the noise of month-to-month fluctuation, and it aligns naturally with budget review cycles.
Does a low cost per hire always mean efficient recruiting?
Not necessarily. A low CPH can reflect genuine efficiency, but it can also indicate skipped assessments, weak sourcing pipelines, or poor candidate experience — all of which reduce upfront spend while increasing downstream costs through mis-hires and turnover.
What is the biggest driver of high cost per hire?
Agency and search firm fees are typically the largest external cost driver — commissions run 15–25% of first-year salary for standard placements and 25–35% for executive search. Over-reliance on these channels during urgent hiring cycles compounds both internal labor costs and external fees at once.